| gene_id | R1232_2DA_1 | R1232_2DA_2 | R1232_2DA_3 | R0_26_2DA_1 | R0_26_2DA_2 | R0_26_2DA_3 | SG2_2DA | SG26_2DA | log2FoldChange | pvalue | padj | gene_name | gene_chr | gene_start | gene_end | gene_strand | gene_length | gene_biotype | gene_description | tf_family | R1232_2DA_1_count | R1232_2DA_2_count | R1232_2DA_3_count | R0_26_2DA_1_count | R0_26_2DA_2_count | R0_26_2DA_3_count | R1232_2DA_1_fpkm | R1232_2DA_2_fpkm | R1232_2DA_3_fpkm | R0_26_2DA_1_fpkm | R0_26_2DA_2_fpkm | R0_26_2DA_3_fpkm | WB_id | |
|---|---|---|---|---|---|---|---|---|---|---|---|---|---|---|---|---|---|---|---|---|---|---|---|---|---|---|---|---|---|---|---|---|---|---|
| 0 | R12H7.3 | 10808.318182 | 12175.395905 | 10052.840549 | 687.508172 | 684.605947 | 755.231679 | 11012.184879 | 709.115266 | 3.958145 | 0.000000e+00 | 0.000000e+00 | - | X | 13223639 | 13224708 | - | 1070 | protein_coding | - | - | 9241 | 10208 | 10340 | 704 | 985 | 724 | 294.588891 | 332.609937 | 276.777893 | 20.014523 | 19.780817 | 21.728719 | WBGene00004825 |
| 1 | C56E10.3 | 3333.373750 | 3266.889634 | 3112.102766 | 12.695463 | 21.545974 | 21.905891 | 3237.455383 | 18.715776 | 7.416474 | 2.914773e-276 | 2.393466e-272 | - | X | 6645654 | 6651753 | + | 1980 | protein_coding | - | - | 2850 | 2739 | 3201 | 13 | 31 | 21 | 49.097665 | 48.228658 | 46.303639 | 0.199726 | 0.336425 | 0.340591 | WBGene00016976 |
| 2 | R12H7.5 | 3824.607776 | 3726.090988 | 3727.523275 | 309.573992 | 314.154201 | 323.372680 | 3759.407346 | 315.700291 | 3.574364 | 3.603489e-273 | 1.972670e-269 | - | X | 13222917 | 13223546 | - | 630 | protein_coding | - | Skp1 | 3270 | 3124 | 3834 | 317 | 452 | 310 | 177.046920 | 172.881616 | 174.303536 | 15.306471 | 15.416637 | 15.801579 | WBGene00004826 |
| 3 | Y54G11A.3 | 29.240121 | 21.469154 | 18.472338 | 2782.259635 | 2846.153657 | 3248.330730 | 23.060537 | 2958.914674 | -7.017885 | 7.391234e-230 | 3.034656e-226 | - | II | 14276651 | 14283977 | + | 1703 | protein_coding | - | DEAD | 25 | 18 | 19 | 2849 | 4095 | 3114 | 0.500733 | 0.368499 | 0.319546 | 50.890200 | 51.669116 | 58.719628 | WBGene00013214 |
| 4 | Y54G2A.25 | 21.052887 | 5.963654 | 8.750055 | 3844.772265 | 4545.505474 | 4317.546850 | 11.922198 | 4235.941530 | -8.491477 | 1.951221e-205 | 6.408980e-202 | - | IV | 2972307 | 2978461 | - | 3817 | protein_coding | - | fn3 | 18 | 5 | 9 | 3937 | 6540 | 4139 | 0.160854 | 0.045669 | 0.067533 | 31.376147 | 36.816912 | 34.821911 | WBGene00002243 |
| 5 | F49B2.6 | 1660.838851 | 1693.677722 | 1713.066252 | 5.859445 | 14.595660 | 15.647065 | 1689.194275 | 12.034057 | 7.109462 | 3.833036e-165 | 1.049166e-161 | - | I | 14331085 | 14339839 | + | 3372 | protein_coding | - | - | 1420 | 1420 | 1762 | 6 | 21 | 15 | 14.364217 | 14.681794 | 14.966249 | 0.054128 | 0.133821 | 0.142851 | WBGene00009865 |
| 6 | F09E10.11 | 28137.183261 | 28951.154468 | 28486.288984 | 5747.138629 | 5824.363283 | 6991.108719 | 28524.875571 | 6187.536877 | 2.205158 | 5.527423e-150 | 1.296812e-146 | - | X | 1504131 | 1504841 | - | 711 | ncRNA | - | - | 24057 | 24273 | 29300 | 5885 | 8380 | 6702 | 1154.125509 | 1190.233560 | 1180.300682 | 251.786954 | 253.259758 | 302.701212 | WBGene00006650 |
| 7 | Y54G11A.1 | 101.755620 | 67.985655 | 48.611415 | 1808.615249 | 1819.592252 | 1826.534075 | 72.784230 | 1818.247192 | -4.656609 | 1.689870e-139 | 3.469093e-136 | - | II | 14256350 | 14269153 | - | 1878 | protein_coding | - | - | 87 | 57 | 50 | 1852 | 2618 | 1751 | 1.580174 | 1.058175 | 0.762551 | 29.998653 | 29.954759 | 29.941248 | WBGene00013212 |
| 8 | C06G3.5 | 6128.729280 | 5874.199141 | 5485.312029 | 1401.383846 | 1469.296418 | 1493.773155 | 5829.413483 | 1454.817806 | 2.002259 | 5.896349e-118 | 1.075953e-114 | - | IV | 7024211 | 7028146 | + | 1353 | protein_coding | - | - | 5240 | 4925 | 5642 | 1435 | 2114 | 1432 | 132.103603 | 126.907350 | 119.434535 | 32.263424 | 33.573681 | 33.987918 | WBGene00015551 |
| 9 | R193.2 | 44345.566917 | 45082.838404 | 39023.299224 | 8677.837529 | 9502.469546 | 6627.053670 | 42817.234848 | 8269.120248 | 2.371991 | 3.545768e-104 | 5.823214e-101 | - | X | 1132999 | 1148343 | - | 5808 | protein_coding | - | VWA | 37915 | 37798 | 40138 | 8886 | 13672 | 6353 | 222.672008 | 226.892714 | 197.935530 | 46.541037 | 50.582141 | 35.126234 | WBGene00020128 |
| 10 | T10B9.7 | 2589.505081 | 2638.320508 | 2086.401917 | 131.837505 | 250.906342 | 198.196159 | 2438.075835 | 193.646668 | 3.645498 | 6.581251e-95 | 9.825808e-92 | - | II | 9783818 | 9787398 | - | 1593 | protein_coding | - | p450 | 2214 | 2212 | 2146 | 135 | 361 | 190 | 47.407059 | 48.411405 | 38.584118 | 2.577949 | 4.869487 | 3.830162 | WBGene00011676 |
Process page
What we had on the start of our data project?
🪱 Worm samples data
At first, we have datasets based on Caenorhabditis elegans. These are fully transparent worms, which live in the soil and are commonly used in labs by researchers. Because of this, scientists directly observe internal organs and cellular structures, as well as changes in these structures over time.
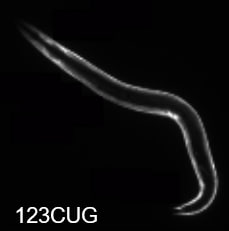
Fluorescent image of Caenorhabditis elegans.
We had different datasets for worms based on their age. Usually, for this type of worms, their aging goes like this:
Development stages:
embryo → L1 → L2 → L3 → L4 → adult
2DA stands for 2-days old worms, which means young worms aka babies.
L4 stands for 4th Larvae stage of Caenorhabditis elegans, which means that these group of worms were teenagers, almost adults.
This data frame shows a glimpse on our data about younger 2DA group of worms.
This data frame is an example for older L4 group of worms.
| gene_id | R123_2_L4_1 | R123_2_L4_2 | R123_2_L4_3 | R0_26_L4_1 | R0_26_L4_2 | R0_26_L4_3 | L4_SG2 | L4_SG26 | log2FoldChange | pvalue | padj | gene_name | gene_chr | gene_start | gene_end | gene_strand | gene_length | gene_biotype | gene_description | tf_family | R123_2_L4_1_count | R123_2_L4_2_count | R123_2_L4_3_count | R0_26_L4_1_count | R0_26_L4_2_count | R0_26_L4_3_count | R123_2_L4_1_fpkm | R123_2_L4_2_fpkm | R123_2_L4_3_fpkm | R0_26_L4_1_fpkm | R0_26_L4_2_fpkm | R0_26_L4_3_fpkm | WB_id | |
|---|---|---|---|---|---|---|---|---|---|---|---|---|---|---|---|---|---|---|---|---|---|---|---|---|---|---|---|---|---|---|---|---|---|---|
| 0 | F28A10.1 | 3723.084124 | 3729.922355 | 3294.560808 | 25.825091 | 50.548356 | 30.235968 | 3582.522429 | 35.536471 | 6.680924 | 2.306031e-273 | 4.281607e-269 | - | II | 826187 | 827610 | + | 1046 | protein_coding | - | - | 3122 | 2956 | 3186 | 26 | 50 | 50 | 109.268136 | 110.365587 | 97.794884 | 0.774074 | 1.540931 | 0.915027 | WBGene00017869 |
| 1 | R12H7.3 | 13430.292570 | 13045.895546 | 12007.671093 | 1562.418000 | 1404.233321 | 1626.695057 | 12827.953069 | 1531.115460 | 3.065531 | 3.086380e-197 | 2.865241e-193 | - | X | 13223639 | 13224708 | - | 1070 | protein_coding | - | - | 11262 | 10339 | 11612 | 1573 | 1389 | 2690 | 385.322232 | 377.359848 | 348.437829 | 45.781063 | 41.846897 | 48.124253 | WBGene00004825 |
| 2 | DY3.7 | 8602.924045 | 8567.717454 | 8388.410946 | 1330.985455 | 1505.330033 | 1333.406172 | 8519.684148 | 1389.907220 | 2.616593 | 8.049516e-150 | 4.981845e-146 | - | I | 8792965 | 8797293 | + | 3337 | protein_coding | - | - | 7214 | 6790 | 8112 | 1340 | 1489 | 2205 | 79.142954 | 79.464746 | 78.050158 | 12.505168 | 14.384120 | 12.648758 | WBGene00006324 |
| 3 | F25C8.1 | 1705.320403 | 1317.333877 | 1229.514376 | 16.885636 | 21.230309 | 17.536861 | 1417.389552 | 18.550936 | 6.265121 | 2.253226e-137 | 1.045891e-133 | - | V | 20907470 | 20909746 | - | 1989 | pseudogene | - | - | 1430 | 1044 | 1189 | 17 | 21 | 29 | 26.320466 | 20.498715 | 19.193277 | 0.266168 | 0.340353 | 0.279099 | WBGene00009104 |
| 4 | R12H7.5 | 5075.415128 | 5136.845030 | 4835.331556 | 699.264000 | 535.812570 | 630.117565 | 5015.863905 | 621.731379 | 3.011539 | 1.532456e-134 | 5.690623e-131 | - | X | 13222917 | 13223546 | - | 630 | protein_coding | - | Skp1 | 4256 | 4071 | 4676 | 704 | 530 | 1042 | 247.316671 | 252.360560 | 238.306563 | 34.799503 | 27.119402 | 31.660857 | WBGene00004826 |
| 5 | F35H8.1 | 2833.455438 | 2315.428796 | 3530.329755 | 159.916909 | 189.050850 | 164.483664 | 2893.071330 | 171.150474 | 4.081859 | 1.482965e-129 | 4.589034e-126 | - | II | 9552631 | 9553261 | - | 494 | protein_coding | - | - | 2376 | 1835 | 3414 | 161 | 187 | 272 | 176.080722 | 145.067474 | 221.890453 | 10.149388 | 12.202799 | 10.539923 | WBGene00009446 |
| 6 | C56E10.3 | 1272.431377 | 1353.926484 | 1180.912882 | 34.764545 | 26.285145 | 14.513264 | 1269.090248 | 25.187652 | 5.715125 | 3.216686e-120 | 8.532029e-117 | - | X | 6645654 | 6651753 | + | 1980 | protein_coding | - | - | 1067 | 1073 | 1142 | 35 | 26 | 24 | 19.728386 | 21.163888 | 18.518379 | 0.550483 | 0.423305 | 0.232029 | WBGene00016976 |
| 7 | F10D2.9 | 720.289177 | 861.819002 | 645.262380 | 4578.987274 | 4753.567370 | 5850.659733 | 742.456853 | 5061.071459 | -2.770908 | 1.214046e-87 | 2.817649e-84 | - | V | 7151356 | 7153146 | - | 1123 | protein_coding | - | - | 604 | 683 | 624 | 4610 | 4702 | 9675 | 19.690172 | 23.752093 | 17.840494 | 127.838626 | 134.973237 | 164.917490 | WBGene00001399 |
| 8 | VZK822L.1 | 7287.561525 | 8394.848928 | 8149.539776 | 27974.533097 | 27757.113081 | 30200.893887 | 7943.983410 | 28644.180022 | -1.850362 | 2.246835e-84 | 4.635220e-81 | - | IV | 11913690 | 11915687 | - | 3488 | protein_coding | - | - | 6111 | 6653 | 7881 | 28164 | 27456 | 49942 | 64.139878 | 74.490687 | 72.544902 | 251.454137 | 253.749727 | 274.084800 | WBGene00001398 |
| 9 | C41C4.5 | 2181.140571 | 1997.451654 | 2144.670156 | 326.786727 | 375.068799 | 361.017453 | 2107.754127 | 354.290993 | 2.572174 | 1.845654e-82 | 3.426825e-79 | - | II | 8116356 | 8122861 | + | 4156 | protein_coding | - | - | 1829 | 1583 | 2074 | 329 | 371 | 597 | 16.111296 | 14.875320 | 16.022684 | 2.465252 | 2.877684 | 2.749757 | WBGene00006832 |
| 10 | M18.1 | 7416.354954 | 7978.450289 | 8247.776838 | 25931.371097 | 27595.358343 | 29512.723265 | 7880.860693 | 27679.817568 | -1.812418 | 5.581165e-82 | 9.420498e-79 | - | IV | 12108671 | 12110258 | - | 1128 | protein_coding | - | Collagen | 6219 | 6323 | 7976 | 26107 | 27296 | 48804 | 201.838393 | 218.914744 | 227.027306 | 720.756878 | 780.072025 | 828.212568 | WBGene00000703 |
Both of datasets above are the cutted version, as our real datasets included over 10.000 data rows together. Explanation of important column names:
gene_id – unique identifier of the gene
gene_name – common name of the gene (if available)
WB_id – WormBase identifier for the gene
baseMean – average expression level of the gene across all samples
FPKM / TPM – normalized expression values that allow comparison between genes and samples
log2FoldChange – how much the gene expression changes between two conditions
lfcSE – uncertainty (error) of the fold change value
pvalue – statistical measure showing whether the change is likely due to chance
padj – corrected p-value used to identify statistically significant genes
chromosome – chromosome where the gene is located
length – length of the gene
biotype – type of gene (e.g., protein-coding or non-coding)
description – short description of gene function
is_tf / TF – indicates whether the gene is a transcription factor
Based on this information, we could explore the structure of the data and detect meaningful differences in gene expression. Therefore, we proceed with EDA to gain initial insights into the dataset and guide further analysis.
1.1. Exploration data analysis (EDA)
Using padj to indentify statistically significant genes, we have found that most significant genes are downregulated, indicating a decrease in L4_SG26 compared to L4_SG2 (different groups of adult worms). Also most significant genes are protein-coding, so we can assume that major transcriptional changes affect functional genes.
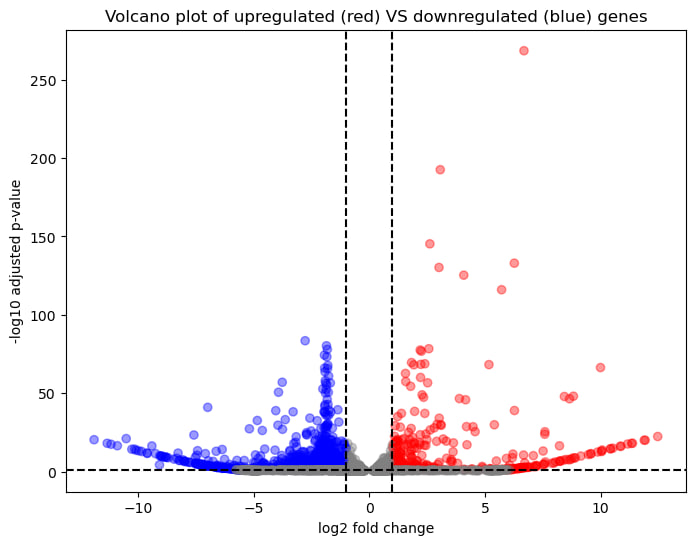
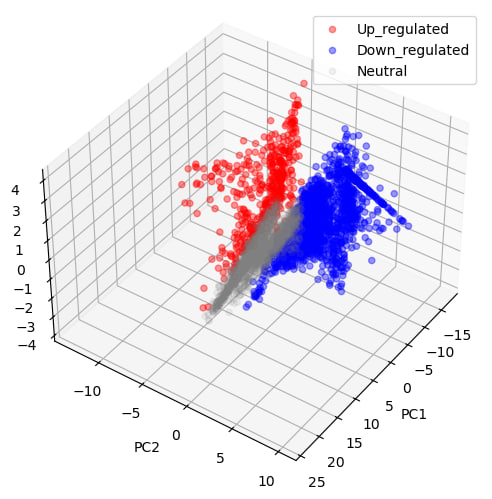
There is a clear distinction between upregulated and downregulated genes, confirming that the two conditions (L4_SG2 vs L4_SG26) differ significantly at the transcriptomic level. Together, these analyses confirm that gene expression patterns and biological pathways differ between developmental stages.
1.2. Differential expression analysis
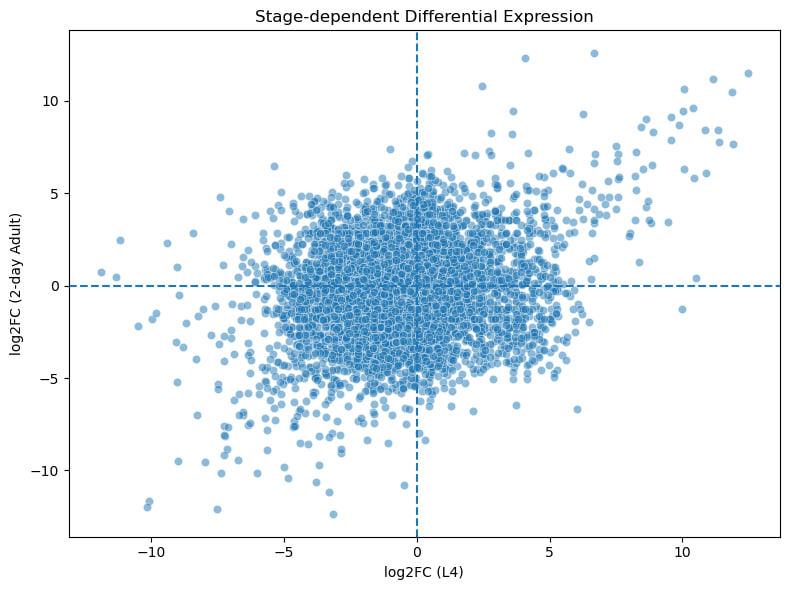
The plot shows gene expression changes in L4 vs 2-day adults. Most genes have little change, while a subset shows strong stage-specific regulation.
1.3. Gene set enrichment analysis (GSEA)
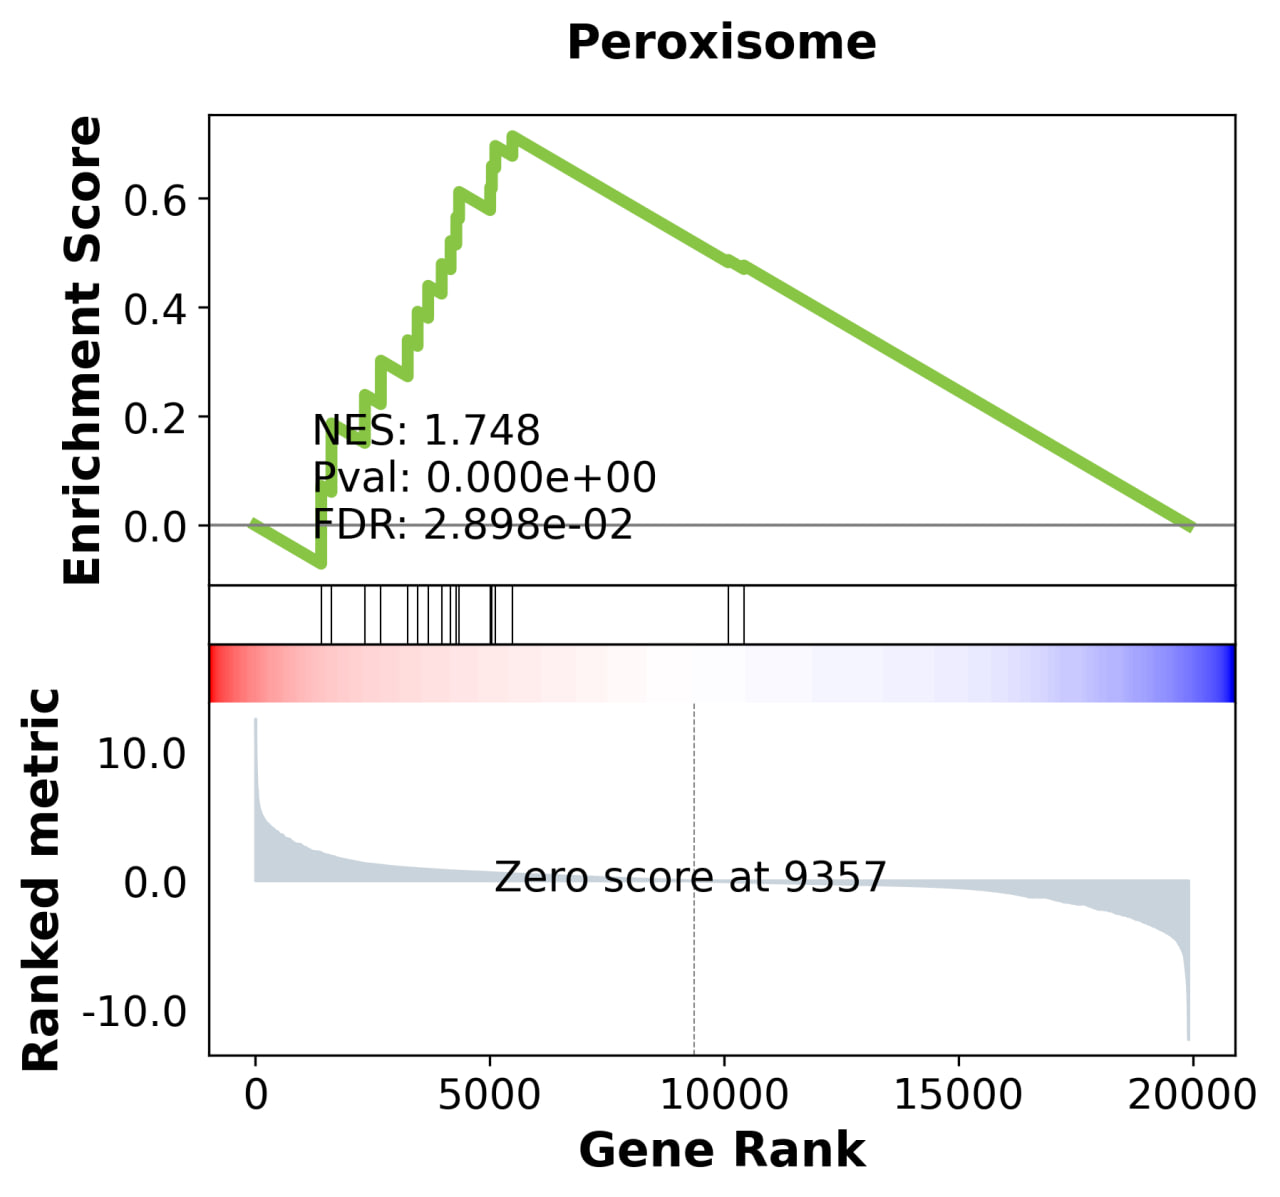
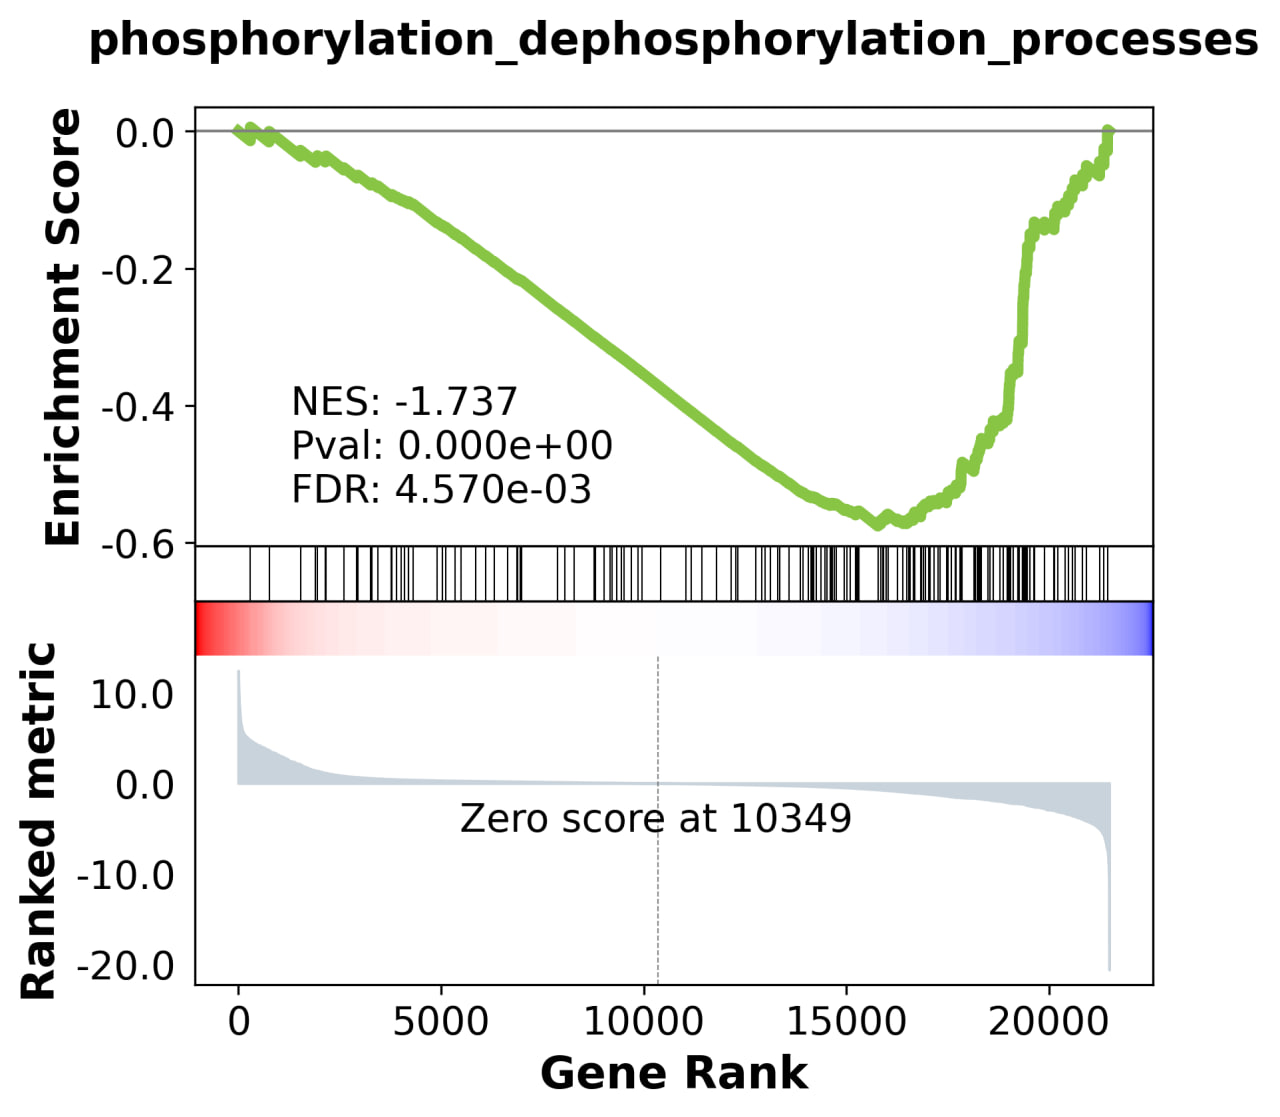
These results highlight stage-specific differences in biological processes between 2DA and L4 worms.
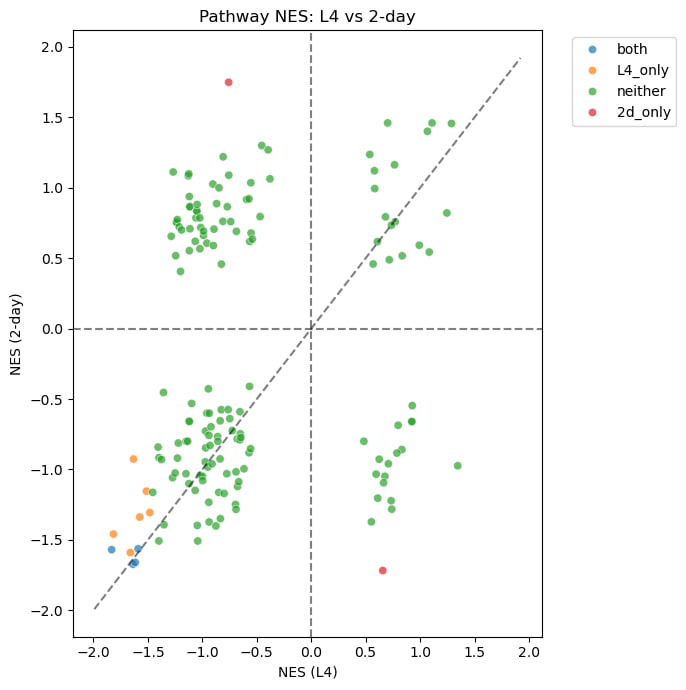
This plot compares pathway activity between L4 and 2-day (2DA) worms. Each point represents a pathway.
Most pathways behave similarly in both stages, especially showing reduced activity. However, some pathways are more active in 2DA than in L4, indicating stage-specific differences.
Overall, this suggests that certain biological processes are more active in 2DA, which is consistent with the GSEA results.
1.4. Pathway analysis
We followed the idea to use g:Profiler for analysing gene lists, which we had.
sources_of_interest = [
    "KEGG",   # metabolic & signalling pathways
    "REAC",   # Reactome pathways
    "WP",     # WikiPathways

    "GO:BP",  # biological processes
    "GO:MF",  # molecular functions
    "GO:CC"   # cellular components
]
As was discussed within team, we decided to focus more on KEGG, REAC, WP and tried to create a different list with pathways to recreate a vizualization.
Our g:Profiler approach gave us a more broad result among downregulated genes:
| source | native | name | p_value | significant | description | term_size | query_size | intersection_size | effective_domain_size | precision | recall | query | parents | |
|---|---|---|---|---|---|---|---|---|---|---|---|---|---|---|
| 0 | KEGG | KEGG:01100 | Metabolic pathways | 5.029174e-19 | True | Metabolic pathways | 897 | 187 | 116 | 2968 | 0.620321 | 0.129320 | query_1 | ['KEGG:00000'] |
| 1 | KEGG | KEGG:01200 | Carbon metabolism | 1.697108e-18 | True | Carbon metabolism | 103 | 187 | 37 | 2968 | 0.197861 | 0.359223 | query_1 | ['KEGG:00000'] |
| 2 | KEGG | KEGG:01230 | Biosynthesis of amino acids | 1.879931e-09 | True | Biosynthesis of amino acids | 69 | 187 | 22 | 2968 | 0.117647 | 0.318841 | query_1 | ['KEGG:00000'] |
| 3 | KEGG | KEGG:00190 | Oxidative phosphorylation | 9.188188e-06 | True | Oxidative phosphorylation | 96 | 187 | 21 | 2968 | 0.112299 | 0.218750 | query_1 | ['KEGG:00000'] |
| 4 | KEGG | KEGG:00010 | Glycolysis / Gluconeogenesis | 2.249896e-05 | True | Glycolysis / Gluconeogenesis | 41 | 187 | 13 | 2968 | 0.069519 | 0.317073 | query_1 | ['KEGG:00000'] |
| 5 | KEGG | KEGG:01212 | Fatty acid metabolism | 1.745630e-04 | True | Fatty acid metabolism | 63 | 187 | 15 | 2968 | 0.080214 | 0.238095 | query_1 | ['KEGG:00000'] |
| 6 | REAC | REAC:R-CEL-1430728 | Metabolism | 2.204675e-04 | True | Metabolism | 1064 | 264 | 105 | 4004 | 0.397727 | 0.098684 | query_1 | ['REAC:0000000'] |
| 7 | KEGG | KEGG:00640 | Propanoate metabolism | 2.876040e-04 | True | Propanoate metabolism | 30 | 187 | 10 | 2968 | 0.053476 | 0.333333 | query_1 | ['KEGG:00000'] |
| 8 | KEGG | KEGG:01040 | Biosynthesis of unsaturated fatty acids | 4.083409e-04 | True | Biosynthesis of unsaturated fatty acids | 25 | 187 | 9 | 2968 | 0.048128 | 0.360000 | query_1 | ['KEGG:00000'] |
| 9 | REAC | REAC:R-CEL-917977 | Transferrin endocytosis and recycling | 4.408555e-04 | True | Transferrin endocytosis and recycling | 20 | 264 | 9 | 4004 | 0.034091 | 0.450000 | query_1 | ['REAC:R-CEL-917937'] |
| 10 | REAC | REAC:R-CEL-77387 | Insulin receptor recycling | 4.408555e-04 | True | Insulin receptor recycling | 20 | 264 | 9 | 4004 | 0.034091 | 0.450000 | query_1 | ['REAC:R-CEL-74752'] |
We compiled a list of network genes based on previously identified upregulated and downregulated gene sets. We then restricted the list to 40 genes and generated a network visualization using cytoscape for biological interpritation of gene lists using the string database by their corresponding WB_id (WormBase identifier for the gene).
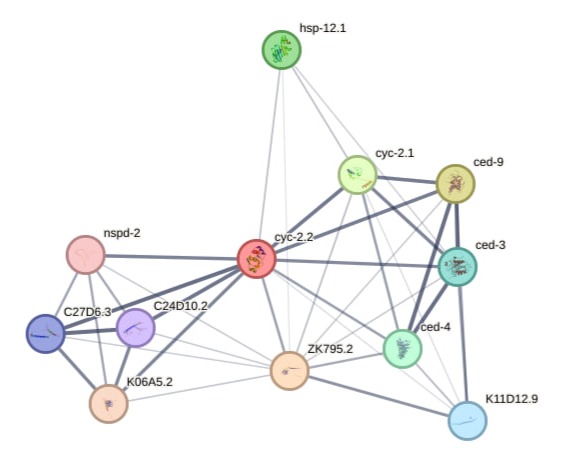
Meanwhile some genes may stay uninvolved; other genes interact with each other on this string network plot. For example, you can see on visualization here that cyc-2.2 (electron carrier protein) here is interacting with many different genes at the same time, and they interact with each other as well, turning everything into string network.
After that, we used previously chosen biological pathways, which are affected by transcriptional changes in the DM1 model. We found out that most of transcriptonic changes are caused by apoptosis (cellular stress / the death of cells), mitochondrial metabolism (energy metabolism), protein processing (cells reaction on stress), and cytoskeleton dynamics (changes in cell structure).
Additional analyses (still working on it)
🏃 Human data samples
At some point, we have finished work with working on worm samples and we have been offered to work with whether mice or human data. We have chosen the last.
Data frame from dataset with human data samples:
| Unnamed: 0 | DM1 | DM1.1 | DM1.2 | DM1.3 | DM1.4 | DM1.5 | DM1.6 | DM1.7 | DM1.8 | DM1.9 | DM1.10 | DM1.11 | DM1.12 | DM1.13 | DM1.14 | DM1.15 | Ctrl | Ctrl.1 | Ctrl.2 | Ctrl.3 | Ctrl.4 | Ctrl.5 | |
|---|---|---|---|---|---|---|---|---|---|---|---|---|---|---|---|---|---|---|---|---|---|---|---|
| 0 | gene | 11832X3 | 11885X4 | 11545X3 | 11545X4 | 11832X2 | 11832X1 | 11885X2 | 11832X4 | 12167X5 | 12167X7 | 11885X1 | 11885X3 | 12167X4 | 12167X10 | 12167X8 | 12167X11 | 11885X13 | 11885X11 | 11885X12 | 11885X16 | 11885X15 | 11885X14 |
| 1 | TTN:ENSG00000155657.19 | 2733270 | 5918620 | 2156564 | 2906657 | 5997728 | 12937419 | 5750155 | 3719573 | 4987055 | 3282911 | 5874714 | 2481992 | 5059765 | 4442596 | 4748835 | 2813414 | 6187163 | 2553862 | 3179365 | 2511608 | 2714806 | 4853218 |
| 2 | NEB:ENSG00000183091.15 | 542809 | 1013643 | 326058 | 359468 | 919344 | 1876455 | 829676 | 764947 | 807184 | 515992 | 957837 | 461102 | 793888 | 617262 | 753158 | 451184 | 596629 | 284077 | 352371 | 337686 | 328065 | 520774 |
| 3 | RN7SL2:ENSG00000265150.1 | 745375 | 424648 | 1049072 | 580437 | 1116446 | 492639 | 250962 | 534655 | 504309 | 1000137 | 178405 | 182946 | 577956 | 668912 | 823843 | 704739 | 470059 | 429154 | 254236 | 443721 | 463935 | 446942 |
| 4 | MT-CO1:ENSG00000198804.2 | 997302 | 292681 | 613228 | 447243 | 672198 | 567995 | 349955 | 540519 | 398712 | 568541 | 347256 | 289823 | 234719 | 621730 | 464804 | 459394 | 714608 | 501756 | 405015 | 486477 | 569275 | 375409 |
| 5 | ACTA1:ENSG00000143632.10 | 675226 | 225569 | 370396 | 315559 | 304708 | 700308 | 168322 | 239437 | 249291 | 355265 | 237808 | 142270 | 240724 | 259678 | 305907 | 180839 | 582098 | 336483 | 244088 | 390215 | 497616 | 638403 |
| 6 | RN7SK:ENSG00000202198.1 | 403671 | 175302 | 504526 | 253615 | 591815 | 283486 | 127061 | 452396 | 181975 | 457371 | 191550 | 312210 | 170562 | 375007 | 384614 | 378260 | 256022 | 228484 | 166543 | 296759 | 319581 | 255374 |
| 7 | MYH7:ENSG00000092054.12 | 402290 | 295401 | 376691 | 200074 | 493153 | 657088 | 241244 | 235809 | 574612 | 237310 | 352163 | 131121 | 339214 | 456909 | 373738 | 238434 | 453862 | 216134 | 252786 | 272765 | 316279 | 322987 |
| 8 | MT-ND4:ENSG00000198886.2 | 564314 | 146010 | 308134 | 320027 | 322889 | 344796 | 202753 | 342929 | 205239 | 295783 | 185555 | 107024 | 132823 | 310682 | 211592 | 294189 | 423613 | 256736 | 243488 | 359049 | 370988 | 280742 |
| 9 | RN7SL1:ENSG00000258486.2 | 286767 | 133721 | 420826 | 236631 | 341706 | 184395 | 87352 | 182257 | 307485 | 514830 | 95278 | 120593 | 293725 | 292615 | 398738 | 351840 | 157114 | 125915 | 71508 | 124744 | 155094 | 130832 |
| 10 | MALAT1:ENSG00000251562.3 | 428971 | 238207 | 156317 | 179399 | 339363 | 503112 | 299572 | 487754 | 223220 | 264110 | 280429 | 268117 | 228365 | 130398 | 183467 | 312418 | 164101 | 132039 | 164530 | 116230 | 96970 | 124090 |
1.1. Exploration data analysis (EDA)
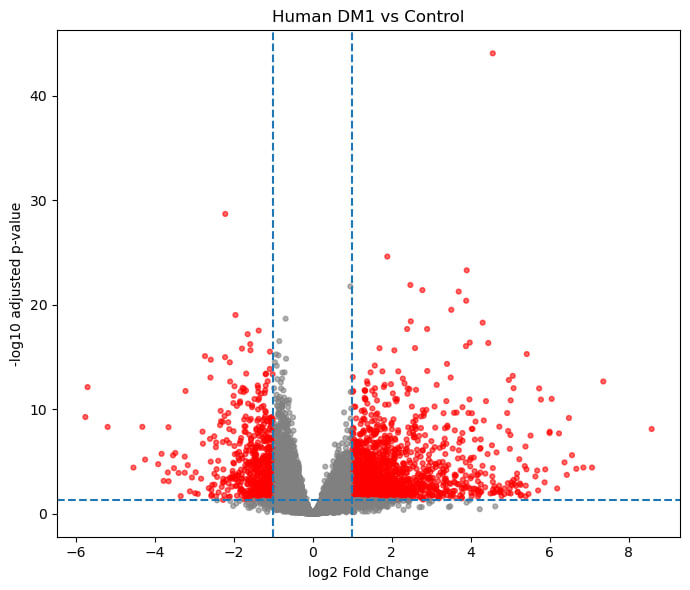
1.2. Differential expression analysis
Compare MBL1 vs CUG
def find_mbl1_dependent(cug_df, mbl1_df, stage_label):
    merged = cug_df[["gene_id", "gene_name", "log2FoldChange", "direction",
                      "gene_biotype", "gene_description", "gene_chr",
                      "pvalue", "padj"]].merge(
        mbl1_df[["gene_id", "log2FoldChange", "direction",
                 "pvalue", "padj"]],
        on="gene_id",
        suffixes=("_cug", "_mbl1")
    )

    concordant  = merged[merged["direction_cug"] == merged["direction_mbl1"]].copy()
    discordant  = merged[merged["direction_cug"] != merged["direction_mbl1"]].copy()

    concordant["stage"] = stage_label
    discordant["stage"] = stage_label

    print(f"\n{stage_label}:")
    print(f"  Total overlap:  {len(merged):>4} genes")
    print(f"  Concordant:     {len(concordant):>4} genes  ← mbl-1-dependent")
    print(f"  Discordant:     {len(discordant):>4} genes  (opposite direction, worth flagging)")
    return concordant, discordant

mbl1_dep_l4,  discord_l4  = find_mbl1_dependent(cug_l4_sig,  mbl1_l4_sig,  "L4")
mbl1_dep_2da, discord_2da = find_mbl1_dependent(cug_2da_sig, mbl1_2da_sig, "2DA")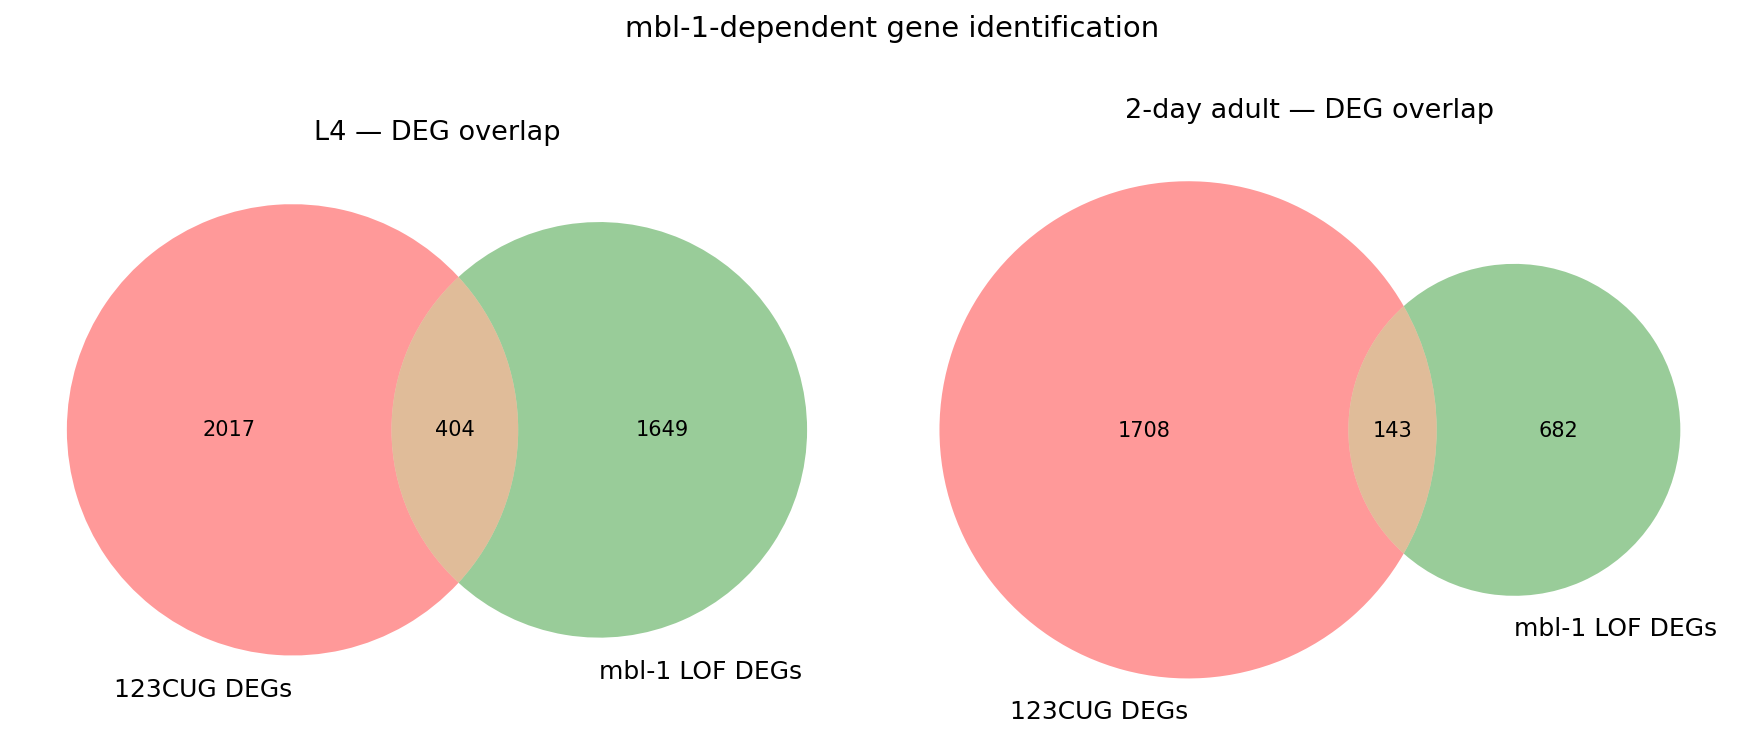
1.3. Gene set enrichment analysis (GSEA)
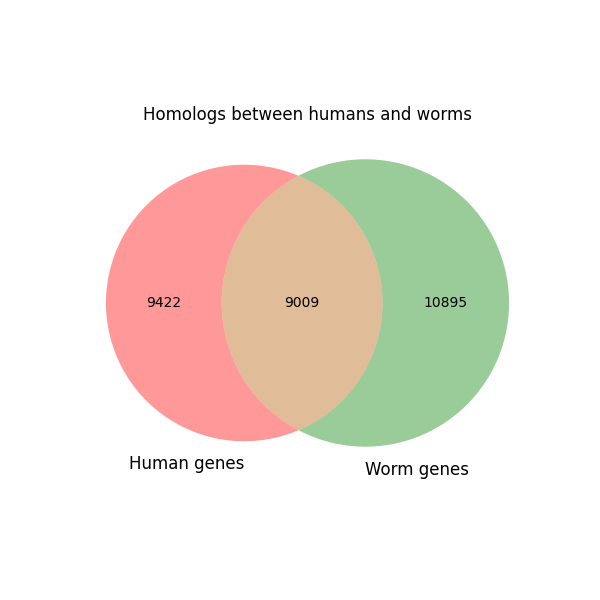

| WormBase ID | Ensembl ID | |
|---|---|---|
| 0 | WBGene00000022 | ENSG00000167972 |
| 1 | WBGene00000040 | ENSG00000122729 |
| 2 | WBGene00000041 | ENSG00000100412 |
| 3 | WBGene00000064 | ENSG00000184009 |
| 4 | WBGene00000066 | ENSG00000184009 |
| 5 | WBGene00000068 | ENSG00000162104 |
| 6 | WBGene00000072 | ENSG00000087274 |
| 7 | WBGene00000081 | ENSG00000018510 |
| 8 | WBGene00000086 | ENSG00000110514 |
| 9 | WBGene00000089 | ENSG00000069974 |
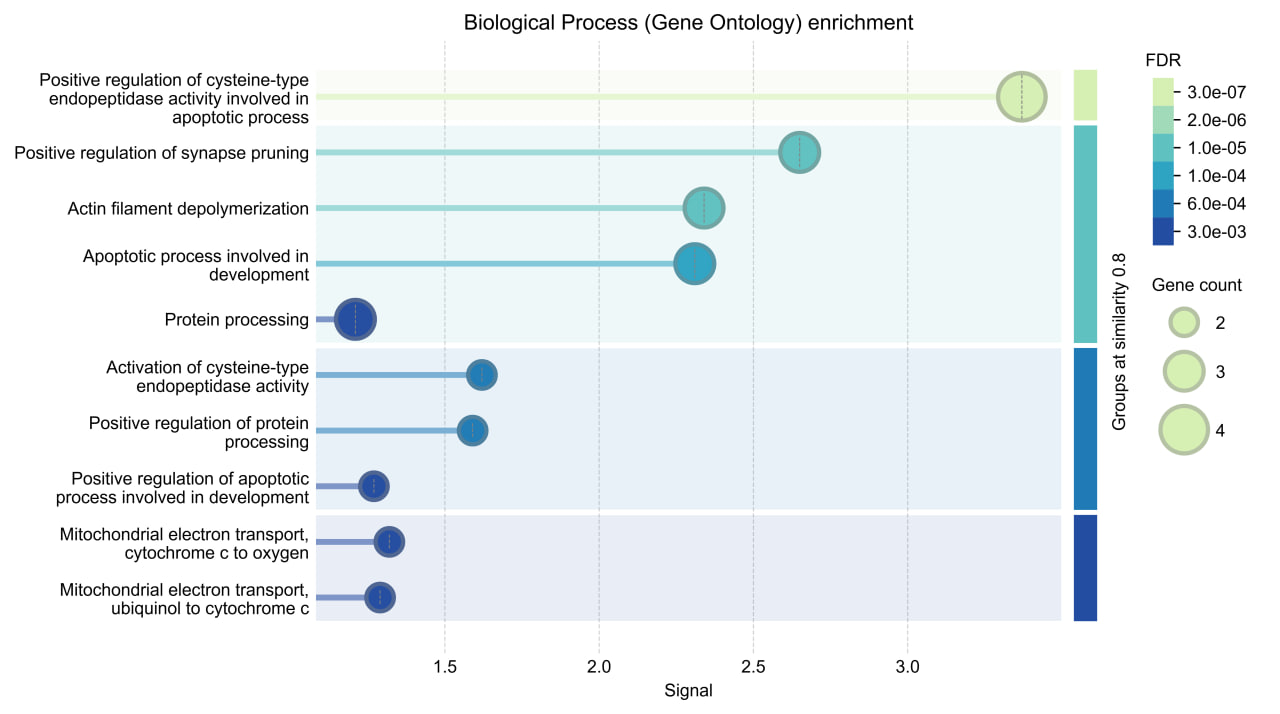
| 10 | WBGene00000092 | ENSG00000121957 |


The visualization shows that these human genes are linked to key cell processes such as cell death, nervous system function, cell structure, and energy production. This indicates that they may play a role in development and diseases, especially those affecting the nervous system.